Unit 2: Patterns in Addition and Subtraction
Unit 6: Measurement
We are learning to read circle graphs.
Like a bar graph or pictograph, a circle graph is a way of organizing or showing data (information). This circle graph shows the favourite after school activities of a group of students:
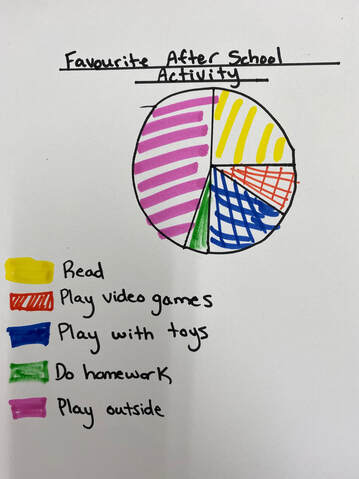
A circle graph is similar to a bar graph because it CAN tell us which activity was the most popular and which activity was the least popular. A circle graph is different from a bar graph because it CANNOT tell us how many students selected each activity as their favourite.
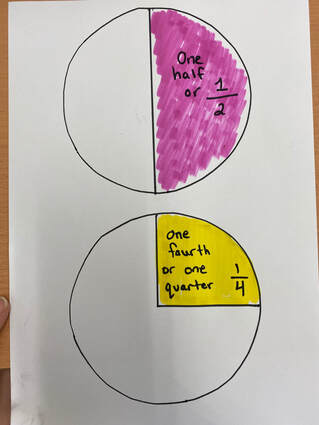
Important fractions vocabulary for reading Circle Graphs:
Unit 3: Geometry
We are learning about parallel sides.
2 lines are parallel if they go in the same direction, stay the same distance apart, and never meet. 2 sides of a shape are parallel if they were to continue, they would never meet or cross.
We are learning to describe angles in a shape.
Two sides of a figure come together to create an angle. An angle can be a right angle, greater (larger) than a right angle,. or less (smaller) than a right angle.
We are learning to name and describe figures.
We can describe and compare figures by:
- number of sides
- number of vertices
- types of angles
- number of pairs (2) parallel lines
- length of sides (how many are the same length?)
- number of sides
- number of vertices
- types of angles
- number of pairs (2) parallel lines
- length of sides (how many are the same length?)
Unit 1: Number Sense
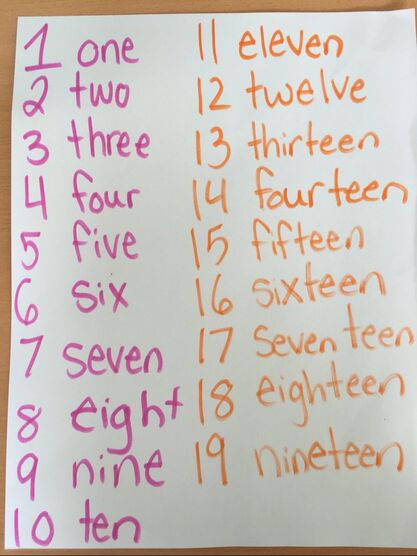
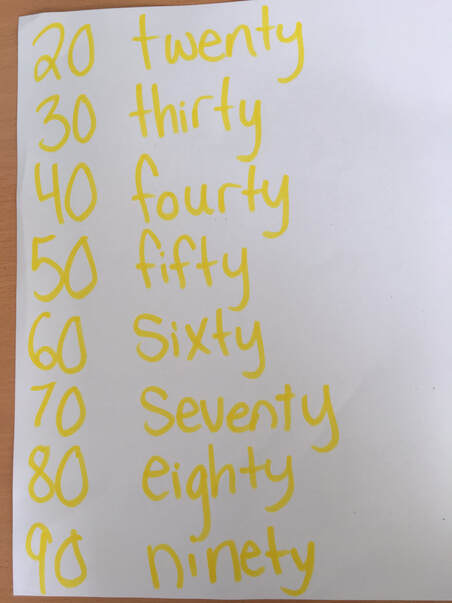
We are learning to write numbers in words.
We are learning to compare numbers on a number line.
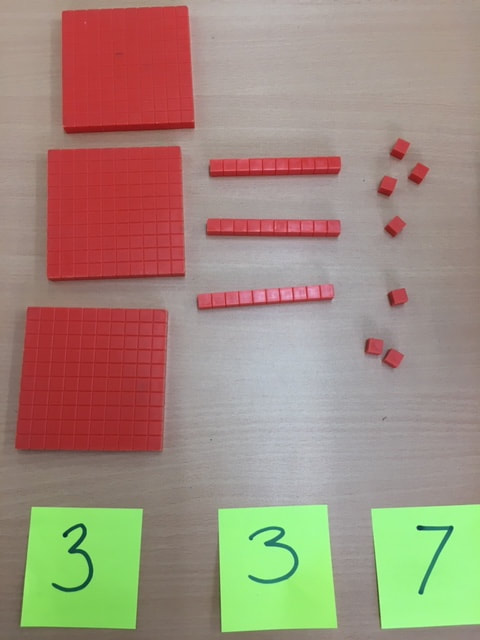
We are learning to model 2 and 3 digit numbers in many ways.
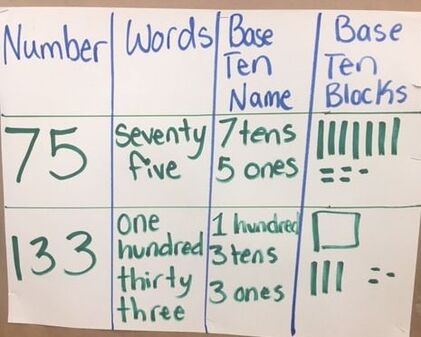
The number 337 is the same as 3 hundreds, 3 tens, and 7 ones. We can model this using base ten blocks.